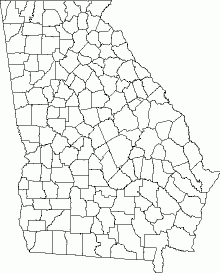
Counties
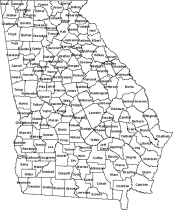
Regional Development Center (RDC) regions
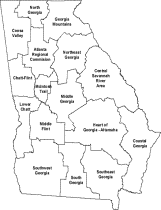
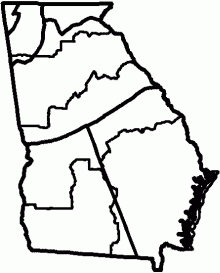
Fiber Inventory Analysis (FIA) units
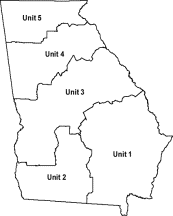
The Move maps section contains maps of Georgia delineated by four attributes:
|
Counties
|
Regional Development Center (RDC) regions
|
Fiber Inventory Analysis (FIA) units
|
|
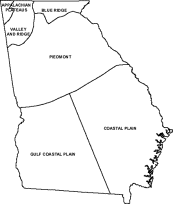
Physiographic regions
|
Every
map shows one, two, or three of these attributes. Displayed to the right of each map is an
information box like the one below:

To view a map, click on one of the leftters "C", "R", "F", or "P" (counties, RDC regions, FIA units, and Phisiographic regions, respectivley) in the navigation box on the left-hand side of the screen:
You may preview maps by moving your mouse around the menu. To view any particular map, simply click on one of the letters.
When you move your mouse over any map, information unique to whichever county, region , or unit the mouse is over is displayed in the information box. Whether information is displayed for each county, each RDC region, each FIA unit, or each Phisisgraphic region depends on which letter you clicked in the navigation box. Click on "C" to view a map where individual county information is displayed in the information box, "R" for RDC regions, "F" for FIA units, and "P" for Phisiographic regions.
For example, the map below can be viewed by clicking on the "P" at the bottom of the blue column located at the far left of the navigation box:
|
|
||
|
[Home] [Livemaps] [Sustainability] [Mensurationists] [FIA mirror] [Comments] [Email URL] |
||
Unique information for each Phisiographic region (delineated by the blue lines on this map) will be displayed in the information box whenever the mouse is placed over each region. For example, the data displayed in the information box to the left of the map will be shown when the mouse is placed over the Coastal Plain phisiographic region. If you click on this region, you will be taken to a new page containing nine tables which contain data on how the land in the Coastal Plain region is broken up into different land-type, ownership, and stand-type classes. These tables are shown below:
|
|
|
|
Coastal
Plain |
|
|
|
|
|
|
|
|
|
|
Table 1--Area by
county and land class
|
|||||
|
Forest
Land |
|||||
|
All |
|
|
Other |
Reserved |
Nonforest |
|
land |
Total |
Timberland |
Forest
Land |
Timberland |
land |
|
-
- - - - - - - - - - thousand acres - - - - - - - - - - - - |
|||||
|
12605.33 |
8940.38 |
8545.08 |
21.30 |
373.83 |
3677.45 |
|
Table 2—Area of
timberland by county and ownership class
|
||||||||||
|
|
|
|
|
|
|
|
|
|
|
|
|
All |
National |
Bureau
of |
Tribal |
Misc. |
|
County
and |
Forest |
Farmer/ |
Private |
Private |
|
Ownership |
Forest |
land
magmt. |
trust |
federal |
State |
municipal |
industry |
rancher |
corp. |
Individual |
|
-
- - - - - - - - - - - - - - - - - - - - - - thousand acres - - - - - - -
- - - - - - - - - - - - - - - - - - |
||||||||||
|
8545.08 |
9.95 |
0.00 |
0.00 |
355.00 |
155.10 |
20.35 |
2457.38 |
1478.23 |
671.95 |
3396.37 |
|
Table 3--Area of
timberland by county and forest type group
|
||||||||||
|
Forest
type group |
||||||||||
|
|
|
Longleaf-slash |
Loblolly-shortleaf |
|
|
|
|
Maple- |
||
|
|
White-red |
pine |
pine |
Oak- |
Oak- |
Oak-gum |
Elm-ash- |
beech- |
||
|
Total |
jack
pine |
Planted |
Natural |
Planted |
Natural |
pine |
hickory |
cypress |
cottonwood |
birch |
|
-
- - - - - - - - - - - - - - - - - - - - - - thousand acres - - - - - - -
- - - - - - - - - - - - - - - - - - |
||||||||||
|
8545.08 |
0.00 |
1322.60 |
839.00 |
1672.03 |
690.88 |
1065.12 |
940.55 |
1961.42 |
52.95 |
0.00 |
|
Table 4--Area of
timberland by county and stand-size class
|
||||
|
Stand-size
class |
||||
|
All |
|
|
Sapling- |
Nonstocked |
|
Classes |
Sawtimber |
Poletimber |
seedling |
areas |
|
-
- - - - - - - - - - - thousand acres - - - - - - - - - - - - - |
||||
|
8545.08 |
2875.10 |
2122.22 |
3368.43 |
179.10 |
|
Table 5--Area of
timberland by county and site class
|
|||||
|
|
|
|
|
|
|
|
All |
Site
class (cubic feet/acre/year) |
||||
|
Classes |
>165 |
120-165 |
85-120 |
50-85 |
20-49 |
|
-
- - - - - - - thousand acres - - - - - - - - - - |
|||||
|
8545.08 |
21.10 |
301.20 |
1981.18 |
5594.20 |
646.90 |
|
Table 6--Area of
timberland by county and stocking classes of growing-stock trees
|
|||||
|
|
|
|
|
|
|
|
|
Stocking
Class (percent) |
||||
|
All |
Over- |
Fully |
Medium |
Poorly |
Non- |
|
Classes |
stocked |
stocked |
stocked |
stocked |
stocked |
|
-
- - - - - - - thousand acres - - - - - - - - |
|||||
|
8545.08 |
35.80 |
729.42 |
4387.32 |
2971.07 |
421.53 |
|
Table 15--Volume of
growing stock and sawtimber on timberland by county and species group
|
|||||||||||
|
Growing
Stock |
Sawtimber |
||||||||||
|
|
Softwood |
Hardwood |
|
Softwood |
Hardwood |
||||||
|
All |
Pine |
|
|
|
All |
Pine |
|
|
|
||
|
species |
Planted |
Natural |
Other |
Soft |
Hard |
species |
Planted |
Natural |
Other |
Soft |
Hard |
|
-
- - - - - - - -million cubic feet- - - - - - - - - |
-
- - - - - - - million board feet (int'l 1/4" rule)- - - - - - - - - |
||||||||||
|
10037.95 |
2320.67 |
2882.07 |
392.27 |
2727.70 |
1715.75 |
31398.63 |
4013.60 |
12687.02 |
1359.65 |
7316.45 |
6021.42 |
|
Table 18--Average net
annual growth of growing stock and sawtimber on timberland by county and
species group
|
|||||||||||
|
Growing
Stock |
Sawtimber |
||||||||||
|
|
Softwood |
Hardwood |
|
Softwood |
Hardwood |
||||||
|
All |
Pine |
|
|
|
All |
Pine |
|
|
|
||
|
species |
Planted |
Natural |
Other |
Soft |
Hard |
species |
Planted |
Natural |
Other |
Soft |
Hard |
|
-
- - - - - - - -million cubic feet- - - - - - - - - |
-
- - - - - - - million board feet (int'l 1/4" rule)- - - - - - - - - |
||||||||||
|
588.92 |
280.90 |
157.88 |
7.70 |
79.65 |
63.43 |
1927.07 |
570.95 |
807.58 |
37.50 |
271.18 |
239.25 |
|
Table 19--Average
annual removals of growing stock and sawtimber on timberland by county
and species group
|
|||||||||||
|
Growing
Stock |
Sawtimber |
||||||||||
|
|
Softwood |
Hardwood |
|
Softwood |
Hardwood |
||||||
|
All |
Pine |
|
|
|
All |
Pine |
|
|
|
||
|
species |
Planted |
Natural |
Other |
Soft |
Hard |
species |
Planted |
Natural |
Other |
Soft |
Hard |
|
-
- - - - - - - -million cubic feet- - - - - - - - - |
-
- - - - - - - million board feet (int'l 1/4" rule)- - - - - - - - - |
||||||||||
|
571.13 |
179.60 |
235.73 |
7.10 |
85.02 |
63.83 |
1902.22 |
392.45 |
1046.57 |
30.65 |
242.58 |
189.32 |
A set of tables similar to these can be viewed for every county, RDC region, FIA unit, or phyisiographic region simply by clicking on whichever county, region or unit you desire information for.